FY March 2026 Second Quarter Financial Results were announced on November 7, 2025
LATEST RESULTS HIGHLIGHTS
The Latest Financial Results
FY March 2026 First Half Results
| (Billion Yen) | FY March 2025 | FY March 2026 | Change from Prior Year | |
|---|---|---|---|---|
| 1st Half | 1st Half | 1st Half | ||
| Global Sales Volume (Thousand Units) | 630 | 609 | -21 | -3% |
| Consolidated Wholesales (Thousand Units) | 590 | 543 | -47 | -8% |
| Net Sales | 2,393.9 | 2,238.5 | -155.4 | -6% |
| Operating Income | 103.0 | -53.9 | -156.9 | - |
| Ordinary Income | 83.5 | -21.3 | -104.8 | - |
| Net Income | 35.3 | -45.3 | -80.6 | - |
| Operating Return on Sales | 4.3% | -2.4% | -6.7pts | |
| EPS(Yen) | 56.1 | -71.8 | -127.9 | |
Exchange Rate (Yen) US Dollar Euro Thai Baht Mexico Peso |
153 166 4.27 8.49 |
146 168 4.47 7.67 |
-7 +2 +0.20 -0.82 | |
*Net income indicates net income attributable to owners of the parent
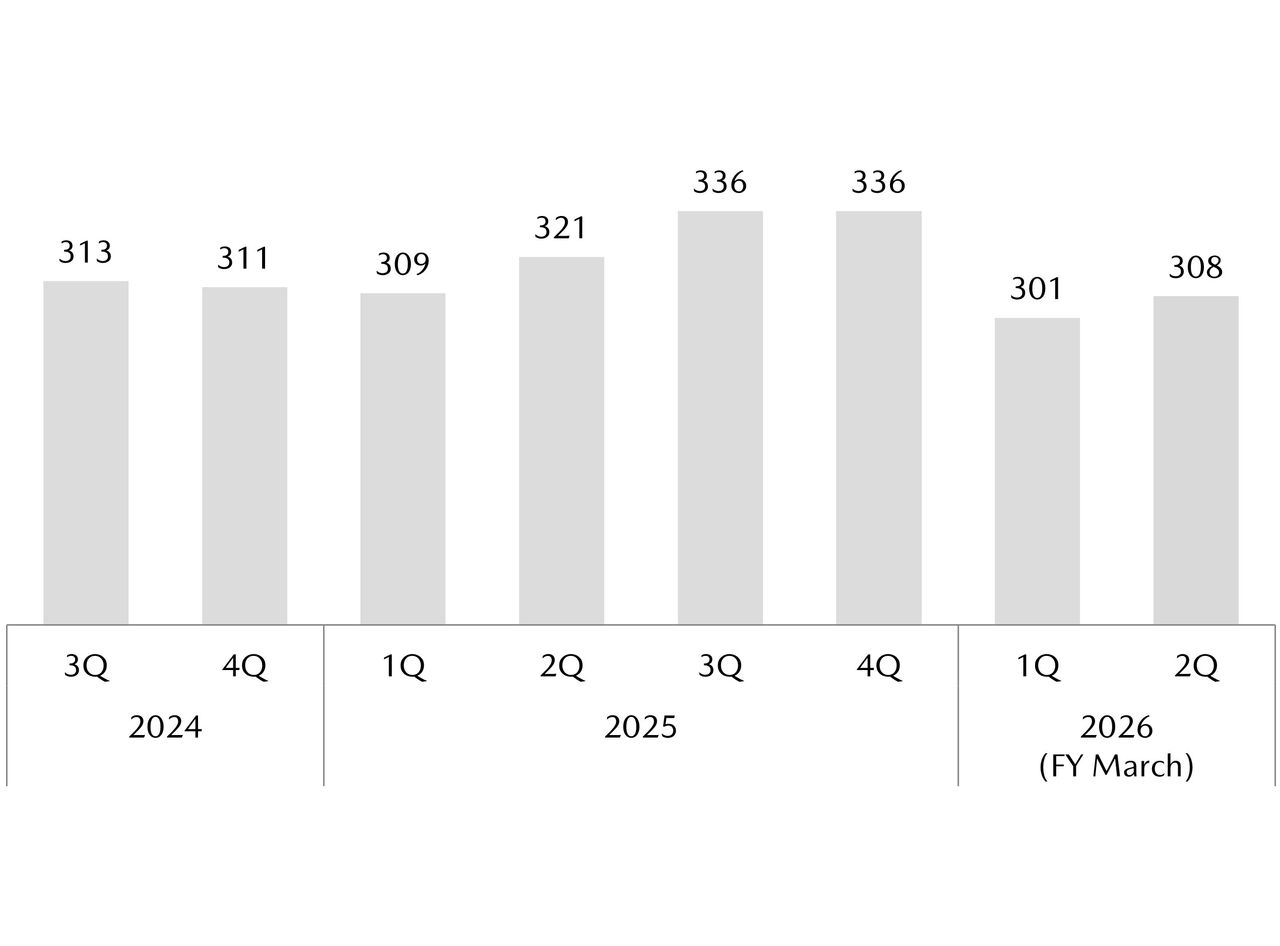
For the first half of fiscal year ending March 31, 2026 (April 1, 2025 through September 30, 2025), global sales volume was 609,000 units, down 3% year on year. This reflects primarily lower sales in Europe but sales in Japan and North America increased year on year.
Consolidated wholesale volume was 543,000 units, down 8% year on year.
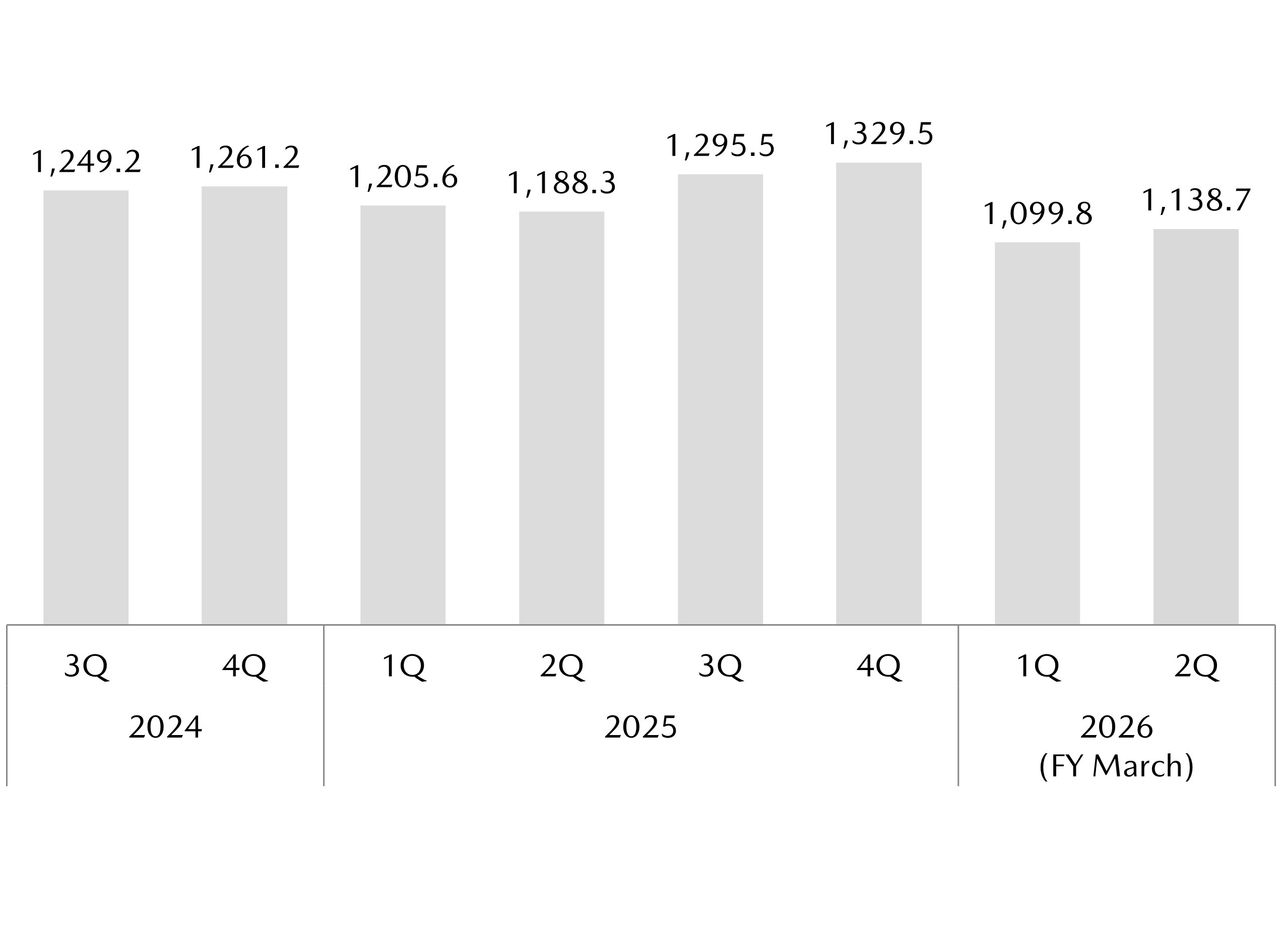
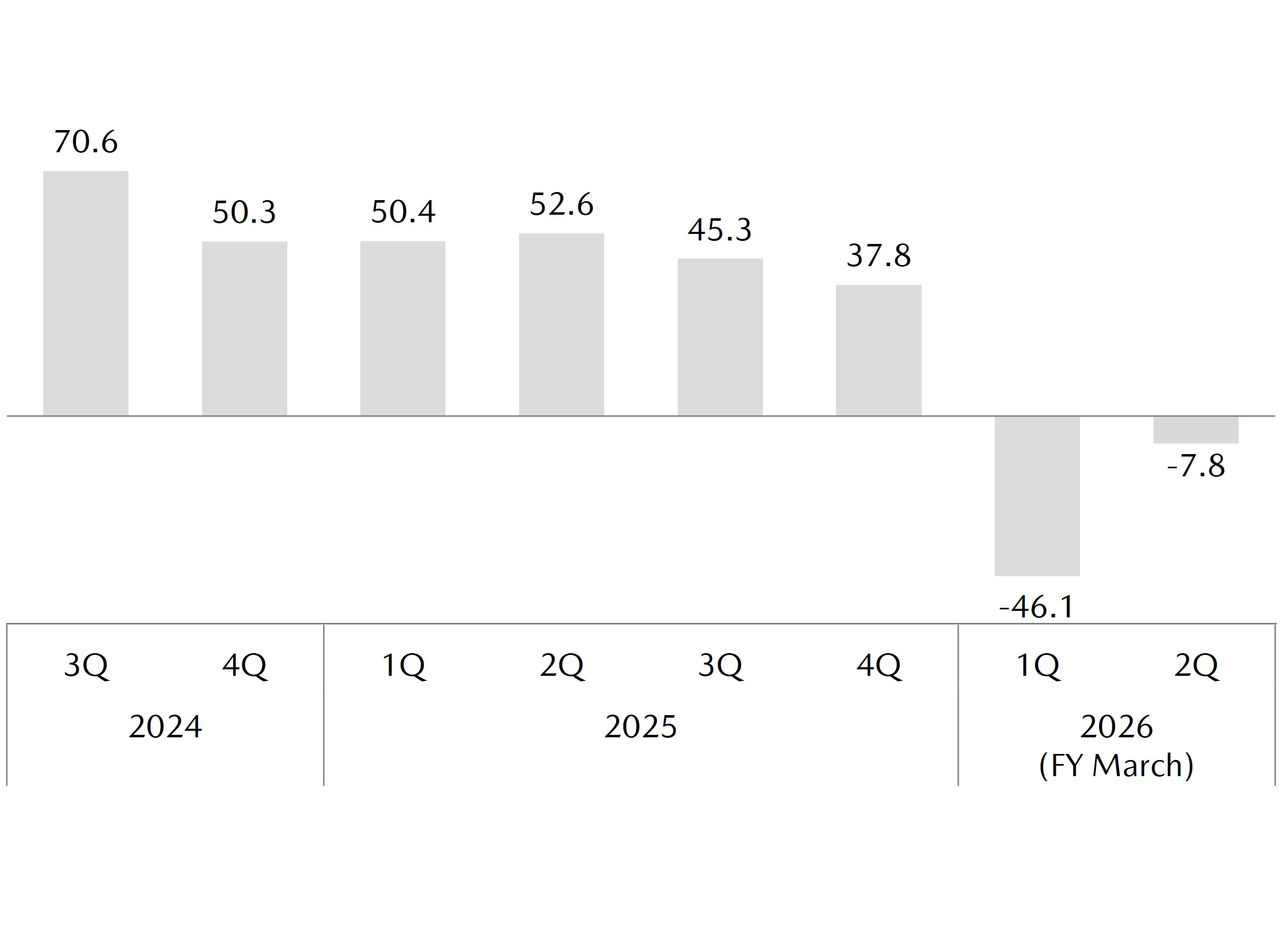
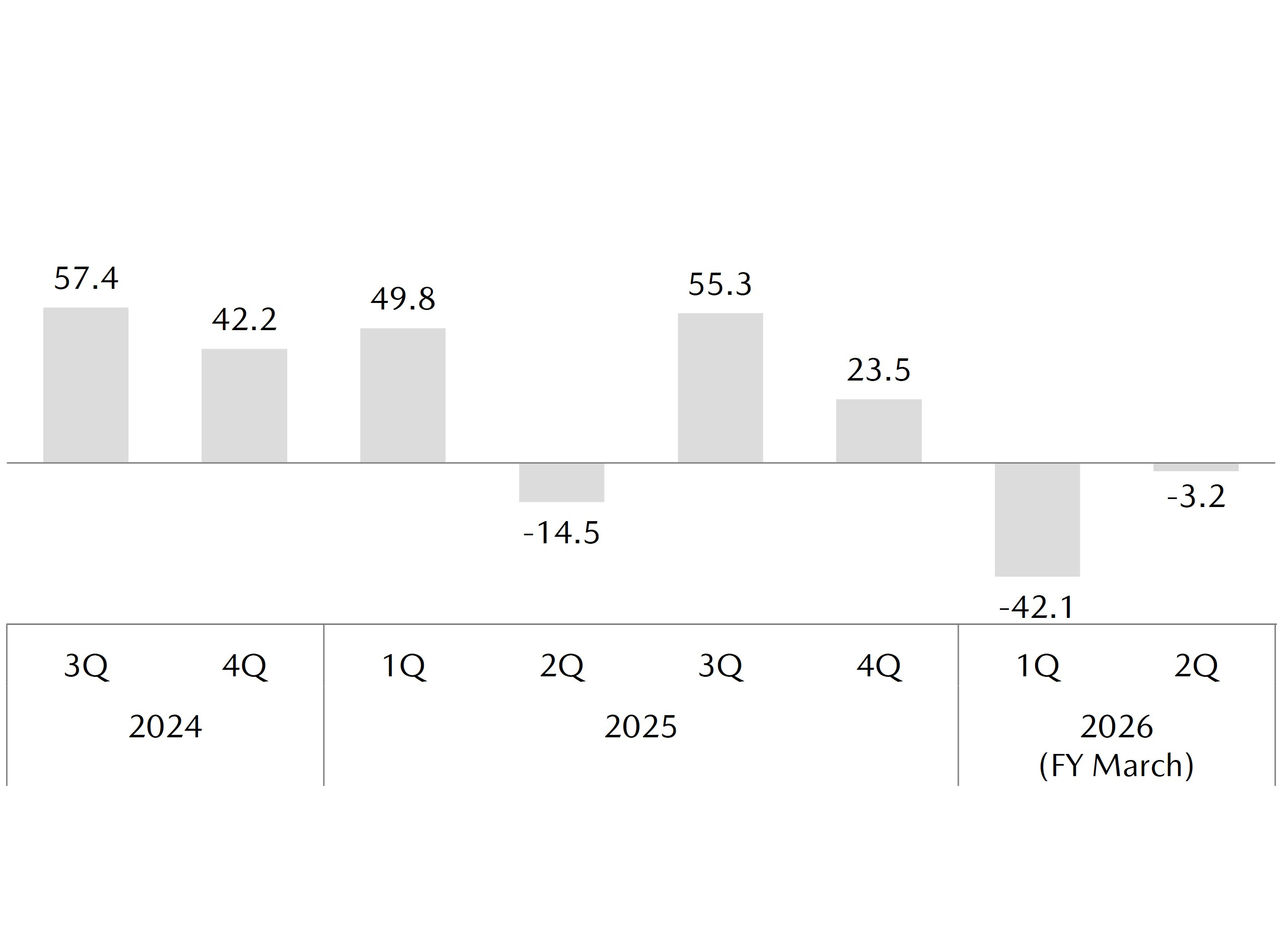
Net sales were ¥2,238.5 billion, down 6% from the prior year, operating loss was ¥53.9 billion, and net loss attributable to owners of the parent was ¥45.3 billion.
The timing of the Japan-US auto tariff reduction was later than initially expected, which had an impact of 10.3 billion yen. As a result, although we aimed for break-even in the second quarter, we posted an operating loss of ¥7.8 billion. We see the second quarter result establishing a foundation for turnaround in the second half of the year.
Average exchange rates for the period were ¥146 to the US dollar, ¥7 stronger from the prior year and ¥168 to the euro, ¥2 weaker from the prior year.
FY March 2026 FORECAST
| (Billion Yen) | FY March 2025 | FY March 2026 | Change from Prior Year | Change from August Forecast | |||
|---|---|---|---|---|---|---|---|
| Full Year | 1st Half | 2nd Half | Full Year | Full Year | Full Year | ||
| Global Sales Volume (Thousand Units) | 1,303 | 609 | 691 | 1,300 | -3 | 0% | 0 |
| Consolidated Wholesales (Thousand Units) | 1,219 | 543 | 650 | 1,192 | -26 | -2% | 0 |
| Net Sales | 5,018.9 | 2,238.5 | 2,661.5 | 4,900.0 | -118.9 | -2% | 0.0 |
| Operating Income | 186.1 | -53.9 | 103.9 | 50.0 | -136.1 | -73% | 0.0 |
| Ordinary Income | 189.0 | -21.3 | 89.3 | 68.0 | -121.0 | -64% | +15.0 |
| Net Income | 114.1 | -45.3 | 65.3 | 20.0 | -94.1 | -82% | 0.0 |
| Operating Return on Sales | 3.7% | -2.4% | 3.9% | 1.0% | -2.7pts | 0.0pts | |
| EPS(Yen) | 181.0 | -71.8 | 103.5 | 3.17 | -149.3 | 0.0 | |
Exchange Rate (Yen) US Dollar Euro Thai Baht Mexico Peso |
153 164 4.38 8.02 |
146 168 4.47 7.67 |
149 174 4.60 8.06 |
147 171 4.54 7.87 |
-5 +7 +0.16 -0.15 |
+2 +2 +0.17 +0.23 | |
*Net income indicates net income attributable to owners of the parent
For the fiscal year ending March 31, 2026 (April 1, 2025 through March 31, 2026), the full year forecast for global sales is 1.3 million units, the same level with the prior year.
Consolidated wholesales volume is 1.192 million units, down 2% year on year, and net sales are forecast at ¥4,900 billion, down 2% from the prior year. Operating income is forecast at ¥50 billion and operating return on sales at 1.0%, unchanged from August forecast.
Ordinary income is forecast at ¥68 billion, revised up ¥15 billion from August forecast. The main factors are foreign exchange gains from the continued depreciation of the yen and increased interest income on U.S. dollar-denominated assets. On the other hand, due to easing of regulations, we have impaired the value of some U.S. emissions credits already purchased. In addition, we are including in our full year forecast some expenses related to changes in our procurement plans for overseas parts. Together, these expenses offset the improvement in ordinary profit so that our net income attributable to owners of the parent forecast is unchanged at 20 billion yen.
Our exchange rate assumptions are ¥147 to the US dollar, ¥5 stronger from the prior year, and ¥171 to the euro, ¥7 weaker from the prior year.
In the second half of the year, we plan to maximize the profit through volume and mix improvement including the launch of the new CX-5, and we expect to see progress in cost reductions so that we can earn about ¥100 billion level operating income. Going forward, we will continue to maintain the production level in Japan and accelerate cost reductions. At the same time, we will work with our suppliers and dealer partners to strengthen the supply chain.
Graphs displaying results and financial data
Global sales volume (Thousands of Units)


Net Sales (Billions of Yen)


Operating Income (Billions of Yen)


Net Income Attributable to Owners of the Parent (Billions of Yen)

