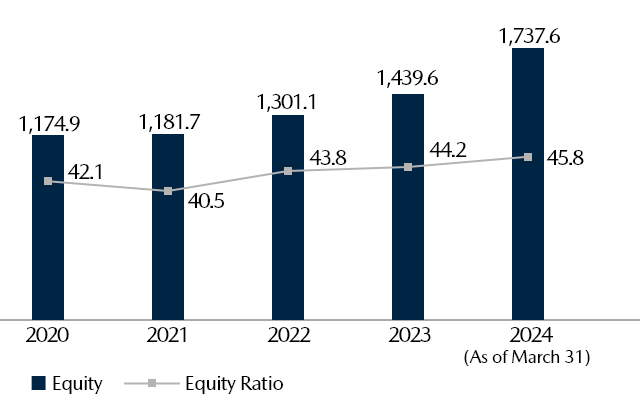
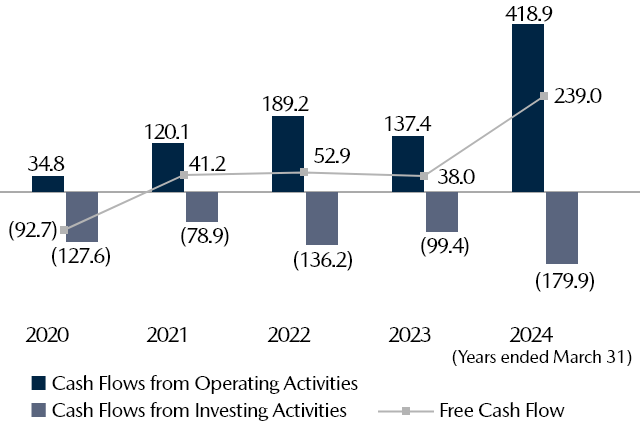
Key Financial Data Trends
Data Download
Key financial data over the last five years
Consolidated Financial Summary |
Excel[15KB] | PDF[21KB] |
Consolidated Balance Sheets |
Excel[23KB] | PDF[43KB] |
Consolidated Statements of Operations and Comprehensive Income |
Excel[22KB] | PDF[39KB] |
Consolidated Cash Flows |
Excel[20KB] | PDF[37KB] |
All Data Download |
Excel[44KB] | PDF[128KB] |
Consolidated Financial Summary
YEARS ENDED MARCH 31 | 2018 | 2019 | 2020 | 2021 | 2022 |
For the year: | |||||
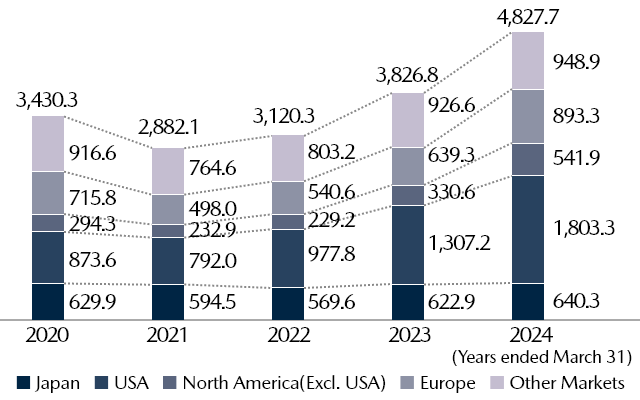
Net Sales (¥bil) | 3,474.0 | 3,564.2 | 3,430.3 | 2,882.1 | 3,120.3 |
Domestic (¥bil) | 631.2 | 693.6 | 629.9 | 594.5 | 569.6 |
Overseas (¥bil) | 2,842.8 | 2,870.6 | 2,800.4 | 2,287.6 | 2,550.7 |
Costs of sales (¥bil) | 2,653.6 | 2,772.2 | 2,683.6 | 2,268.4 | 2,432.6 |
Selling, general and administrative expenses (¥bil) |
674.0 | 709.7 | 703.0 | 604.8 | 583.5 |
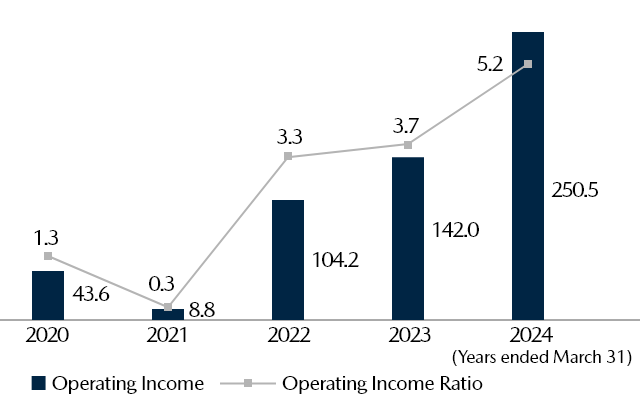
Operating income (¥bil) | 146.4 | 82.3 | 43.6 | 8.8 | 104.2 |
Ordinary income (¥bil) | 172.1 | 116.1 | 53.1 | 28.3 | 123.5 |
Income before income taxes (¥bil) | 157.5 | 107.6 | 49.3 | 2.2 | 112.4 |
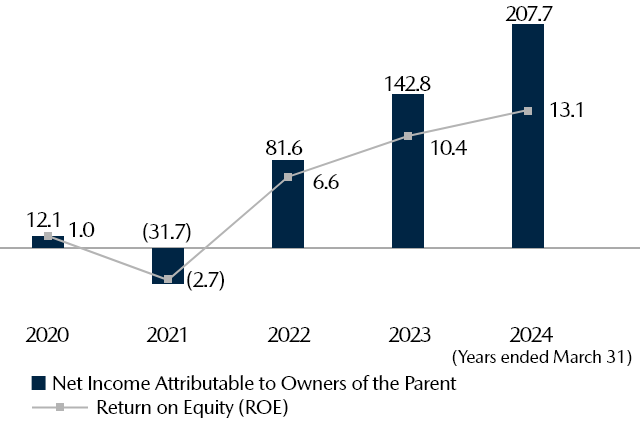
Net income/(loss) attributable to owners of the parent (¥bil) | 112.1 | 63.2 | 12.1 | (31.7) | 81.6 |
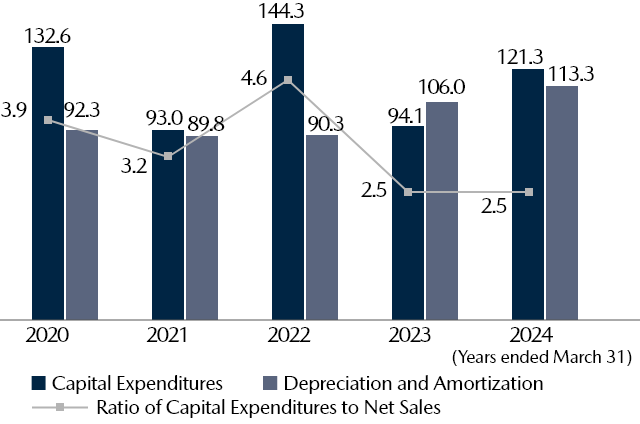
Capital expenditure (¥bil) | 104.1 | 119.7 | 132.6 | 93.0 | 144.3 |
Depreciation and amortization (¥bil) |
87.0 | 88.4 | 92.3 | 89.8 | 90.3 |
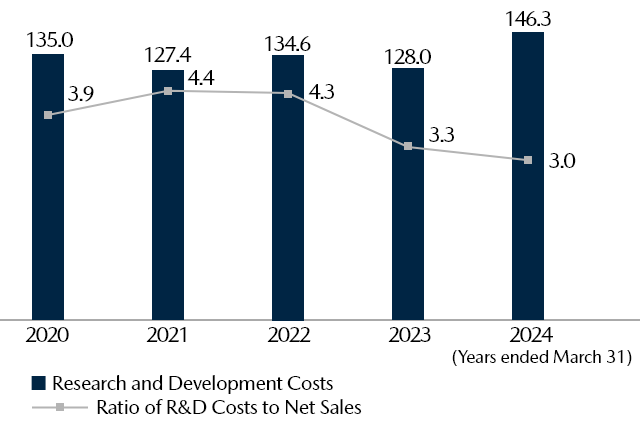
R&D cost (¥bil) | 136.0 | 134.7 | 135.0 | 127.4 | 134.6 |
Cash flows from operating activities (¥bil) |
207.8 | 146.7 | 34.8 | 120.1 | 189.2 |
Cash flows from investing activities (¥bil) |
(160.0) | (131.6) | (127.6) | (78.9) | (136.2) |
Cash flows from financing activities (¥bil) |
30.5 | 83.4 | (24.3) | 99.3 | (86.4) |
At the year-end: | |||||
Total assets (¥bil) | 2,724.1 | 2,877.6 | 2,787.6 | 2,917.4 | 2,968.1 |
Net assets (¥bil) | 1,219.5 | 1,233.4 | 1,205.8 | 1,195.8 | 1,316.7 |
Financial debt (¥bil) | 497.9 | 607.1 | 619.9 | 755.9 | 680.8 |
Net cash (¥bil) | 107.0 | 94.6 | (51.9) | (17.1) | 59.6 |
Amounts per share of common stock: | |||||
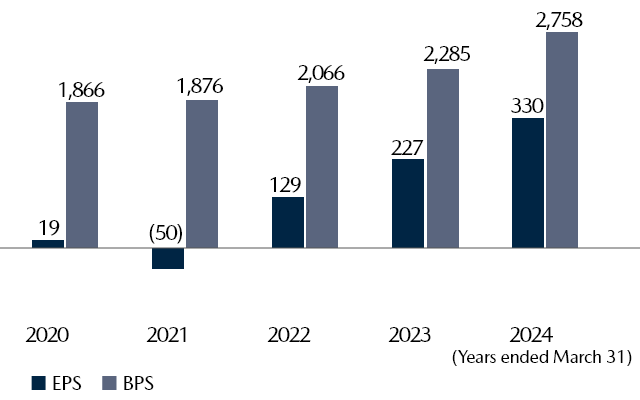
Net income/(loss) (¥) | 183 | 100 | 19 | (50) | 129 |
Cash dividends applicable to the year (¥) |
35 | 35 | 35 | - | 20 |
Net assets (¥) | 1,894 | 1,911 | 1,866 | 1,876 | 2,066 |
Operating income to sales (%) | 4.2 | 2.3 | 1.3 | 0.3 | 3.3 |
Return on equity (%) | 10.0 | 5.3 | 1.0 | (2.7) | 6.6 |
Equity ratio (%) | 43.8 | 41.8 | 42.1 | 40.5 | 43.8 |
*1 Some data may be without continuity due to changes in accounting standards, etc. For the contents of changes in accounting standards, etc., please see our consolidated financial results posted on IR Library page.
*2 The amounts of net assets used in the calculation of net assets per share exclude non-controlling interests and stock acquisition rights.